Android is the dominant mobile operating system today with about 85% of all mobile devices running Google’s OS. The Google Play Store is the largest and most popular Android app store.
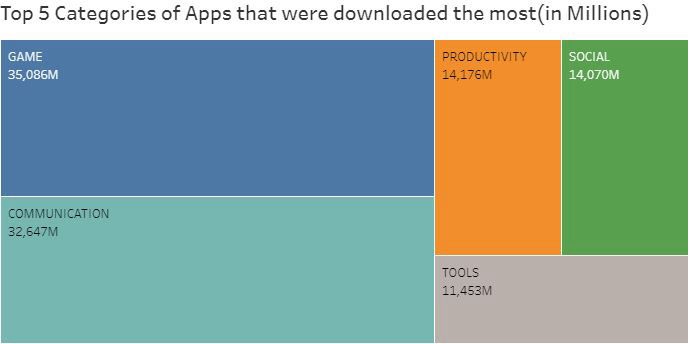
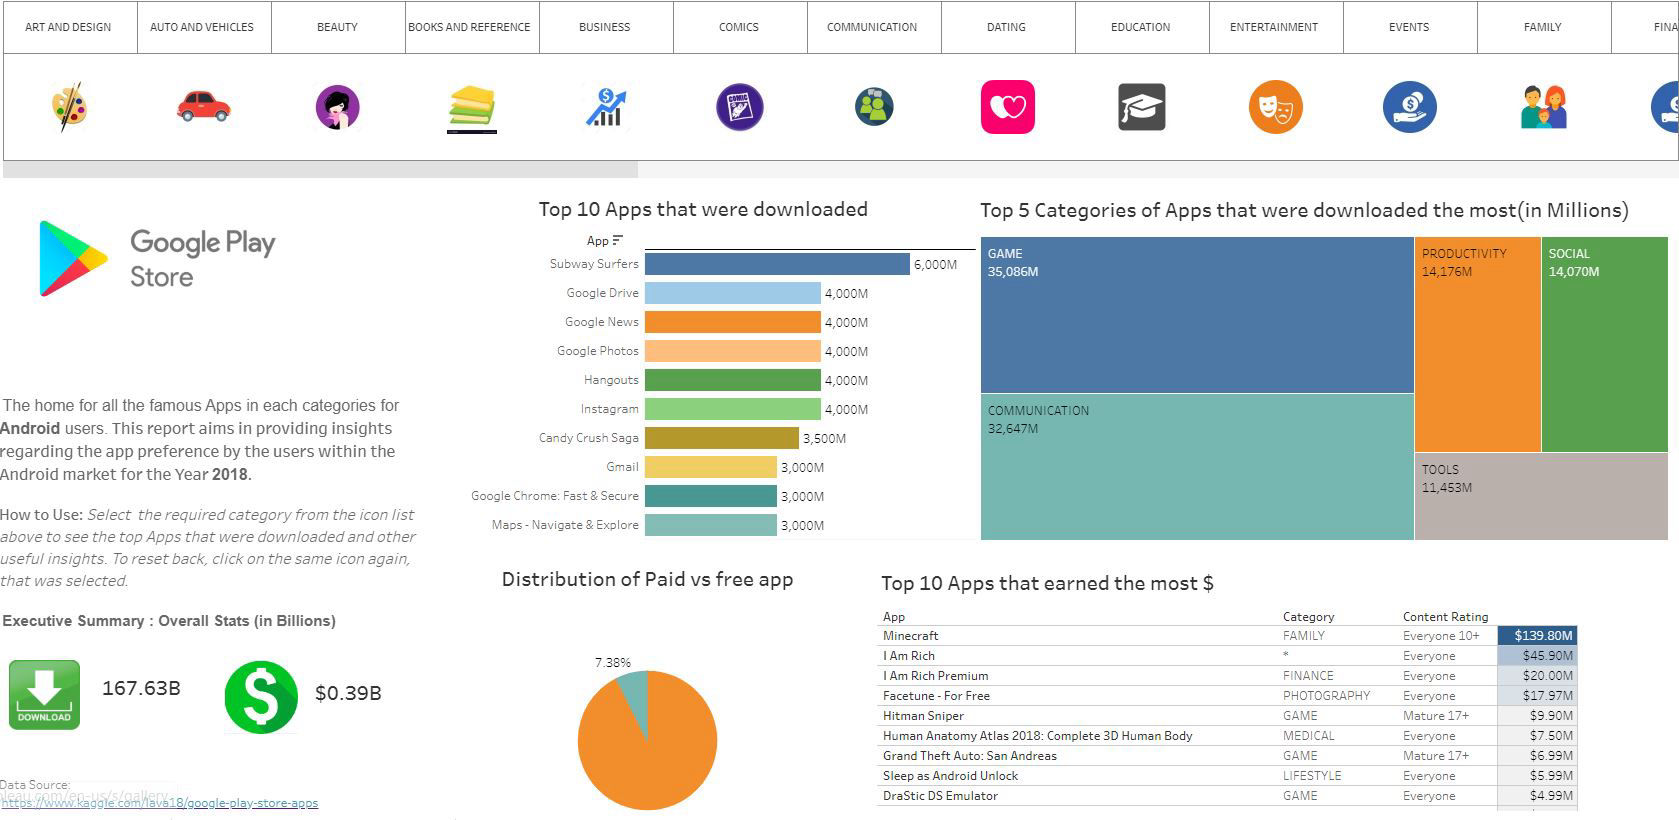
The purpose of this dashboard was to gather and analyze detailed information on apps in the Google Play Store in order to provide insights on app features and the current state of the Android app market.
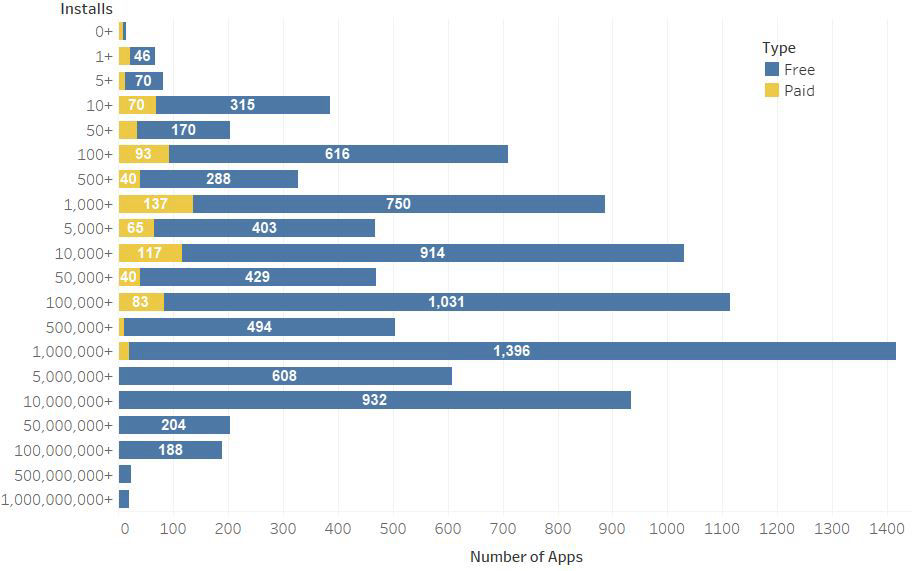
Data collection on over 3,100 apps across 11
different categories in the Google App Store. Identifying relevant KPIs such as No of
downloads, Total Profit, Category of App etc.
By using dashboards, you will discover the right insights in an easy way. You can apply filters yourself and consult different graphs. By immediately having the right information available, correct decisions can be made.
First, we tried to identify which apps were downloaded the most and it was observed Game & Communication apps were downloaded the most. Game category generated around
$40 Mn of revenue with 35.1 Bn downloads in total for the year 2018.
Within Game category, the top 10 games that were downloaded the most. It was observed that most of the top 10 games were free apps available in play store. Addition of adds in this free apps can be one source for revenue generation.
Around 7.8 percent of total apps that were downloaded
belongs to paid category.
Within the paid category, most of the apps in the Google Play Store are inexpensive. The majority of the apps cost between $1 and $3. App prices range from $0.49 to $399.99.
Counter-intuitively, $1-2 apps and $2-3 apps have more aggregated downloads than cheaper apps, which are below $1. Expensive apps, which are above $30, are less popular, and there are also fewer of these apps available for download in the Google Play Store.
On further drilling, it was observe Medical and Family apps category are the most expensive and even extend upto 100$.
No of Paid apps downloaded were very less when compared to Free apps. No of paid apps that were downloaded 1k+ and 10k+ times by the users lies within a ball park range.
On the other hand overall, 8% of the apps had been downloaded fewer than 100 times, and about 62% of the apps had been downloaded fewer than 50K times. Top apps that were downloaded between 500M to 1B+ times were Instagram, Facebook, Google+ & Google News.
It was observed from the data that most of the apps size falls between 0 - 1GB, hence the graph has been filtered accordingly. Within this range, most top rated apps are optimally sized between ~2MB to ~100MB - neither too light nor too heavy.
For Paid category, top rated apps have size more than 100Mb, meaning people are ready to pay for heavy apps like games with good graphics or other applications, whereas for free apps, most of them lies within 100Mb.
1. Average rating of (active) apps on Google Play Store is 4.17.
2. Users prefer to pay for apps that are light-weighted. Thus, a paid app that is bulky may not perform well in the market.
3. Most of the top rated apps are optimally sized between ~2MB to ~100MB - neither too light nor too heavy.
4. Most of the top rated apps are optimally priced between ~1$ to ~30$ - neither too
cheap nor too expensive.
5. Medical and Family apps are the most expensive and even extend upto 100$.
6. Games and Communication category of apps were downloaded the most by the users.
7. Users tend to download a given app more if it has been reviewed by a large population.